
Page 46 - English
P. 46
25,000 20,000 15,000 10,000
5,000 0
Business Customers
''Opt-up''
Banks
Corporate
MDBs
Mortgages
PSEs
Securities & Investment Firms
Sovereigns
SPVs
''Opt-up''
Business Customers
Banks
Corporate
MDBs
Mortgages
PSEs
Securities & Investment Firms
Sovereigns SPVs
December 2014 On-balance sheet originated credit
Debt instruments
December 2015
Off-balance sheet exposures Gross originated credit post CRM
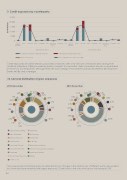
Credit exposures are dominated by corporates and banks with a fair amount of reclassification arising from credit risk mitigation (CRM) provided by banks in respect of corporates. Debt instruments are also concentrated in these two counterparties, although there are also holdings of instruments issued by Multilateral Development Banks (MDBs) and sovereigns.
6.8% 1.9%
0.9% 9.8%
9.8%
2.3% 1.5%
0.1%1.1% 0.1%
0.8% 3.2%
8.1%
0.0%1.3% 0.1%
1.9% 1.9%
13.7% 4.1%
4.6%
38.9%
0.8% 0.3%
4.6% 12.6%
2.8% 1.8%
8.8% 8.7%
2.2%
43.5%
Agriculture & Fishing Basic Materials Business Services Construction Consumer Goods Consumer Services Financials Government Services Health Care
Industrials
Technology
Real Estate
Oil & Gas
Telecommunications
Transport, Storage and Logistics Travel and Tourism
Utilities
0.4%
0.6%
44
9. Credit exposures by counterparty
10. Sectoral distribution of gross exposures
2015 December
2014 December
Gross exposures (including equity) are reflected. Some changes in the relative size of different sectors are evident, but financials have remained the largest exposure. Construction is the only other sector that exceeds 10%.
QAR Millions
