
Page 47 - English
P. 47
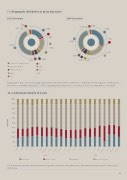
11. Geographic distribution of gross exposures
2015 December
3.2% 3.5%
42.9%
China (incl. Hong Kong) GCC excl. Qatar
MENA excl. GCC
Qatar
2.7%
2.2%
17.00% 2.4%
17.0%
30.2%
3.3%
29.2%
1.5%
19.7%
4.7%
4.8%
5.5%
5.7%
EU India
Other UK
USA
100% 90% 80% 70% 60% 50% 40% 30% 20% 10% 0
Again, gross exposures (including equity) are reflected. Qatar continues to dominate and has grown, while China has shown a marked decrease. “Other” geographies comprise 17 countries in 2015 as compared to 16 in 2014.
2014 December
12. Contractual maturity of assets
Short-term
2014 Medium-term
Long-term
2015 Non-contractual
On a contractual basis, the dominant long-term maturities are reflective of the term-lending nature of loans and advances.
45
Percent
April
March
May
June
July August
September October
November December
January February
March
April
May
June
July
August September
October November
December
