Page 54 - Annual Report 2016 EN
P. 54

| 54


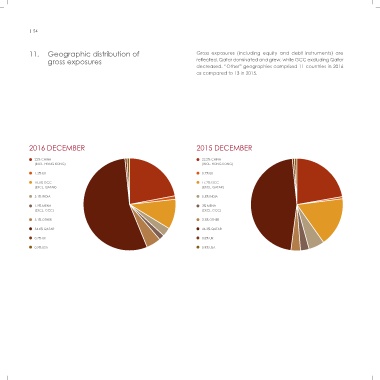
            11.  Geographic distribution of                                  Gross  exposures  (including  equity  and  debt  instruments)  are
                    gross exposures                                          reflected. Qatar dominated and grew, while GCC excluding Qatar
                                                                             decreased. “Other” geographies comprised 11 countries in 2016
                                                                             as compared to 13 in 2015.


            2016 DECEMBER                                                    2015 DECEMBER

              22% CHINA                                                        22.2% CHINA
              (INCL. HONG KONG)                                                (INCL. HONG KONG)

              1.2% EU                                                          0.7% EU
              10.5% GCC                                                        17.2% GCC
              (EXCL. QATAR)                                                    (EXCL. QATAR)
              3.1% INDIA                                                       5.5% INDIA
              1.9% MENA                                                        3% MENA
              (EXCL. GCC)                                                      (EXCL. GCC)

              5.1% OTHER                                                       3.3% OTHER
              54.6% QATAR                                                      46.3% QATAR
              0.7% UK                                                          0.8% UK

              0.9% USA                                                         0.9% USA
   49   50   51   52   53   54   55   56   57   58   59